![]()
You are here
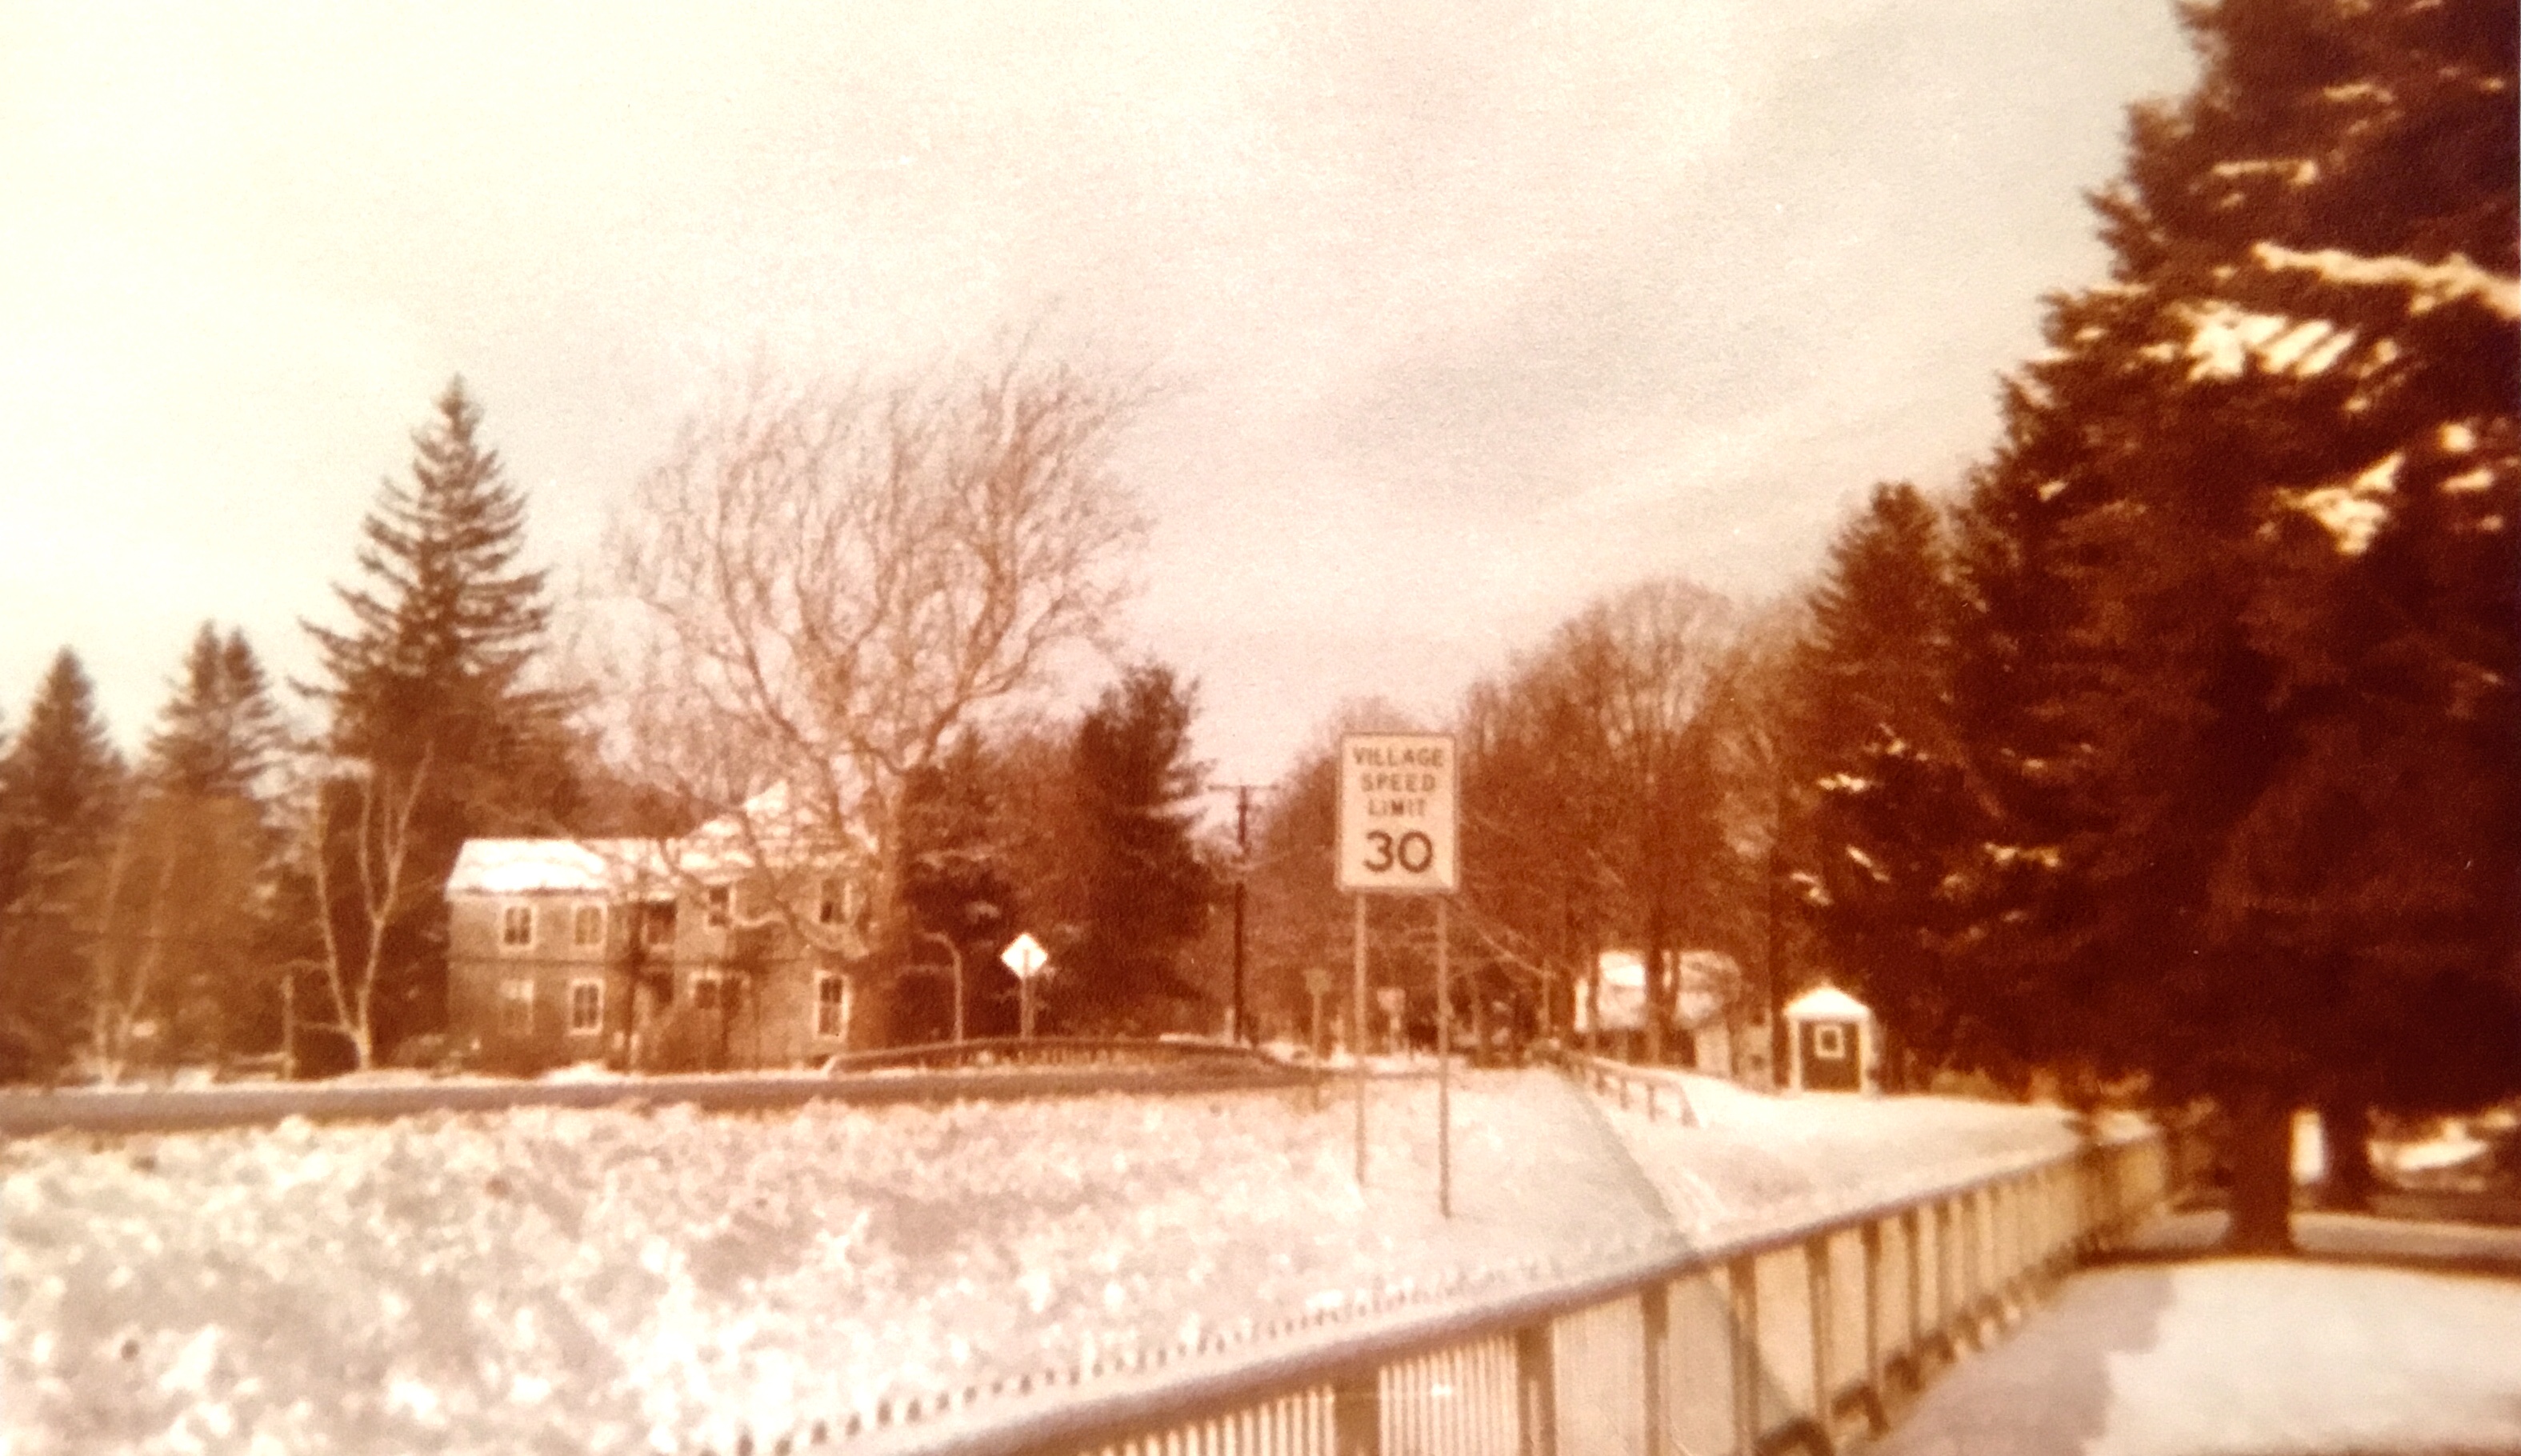
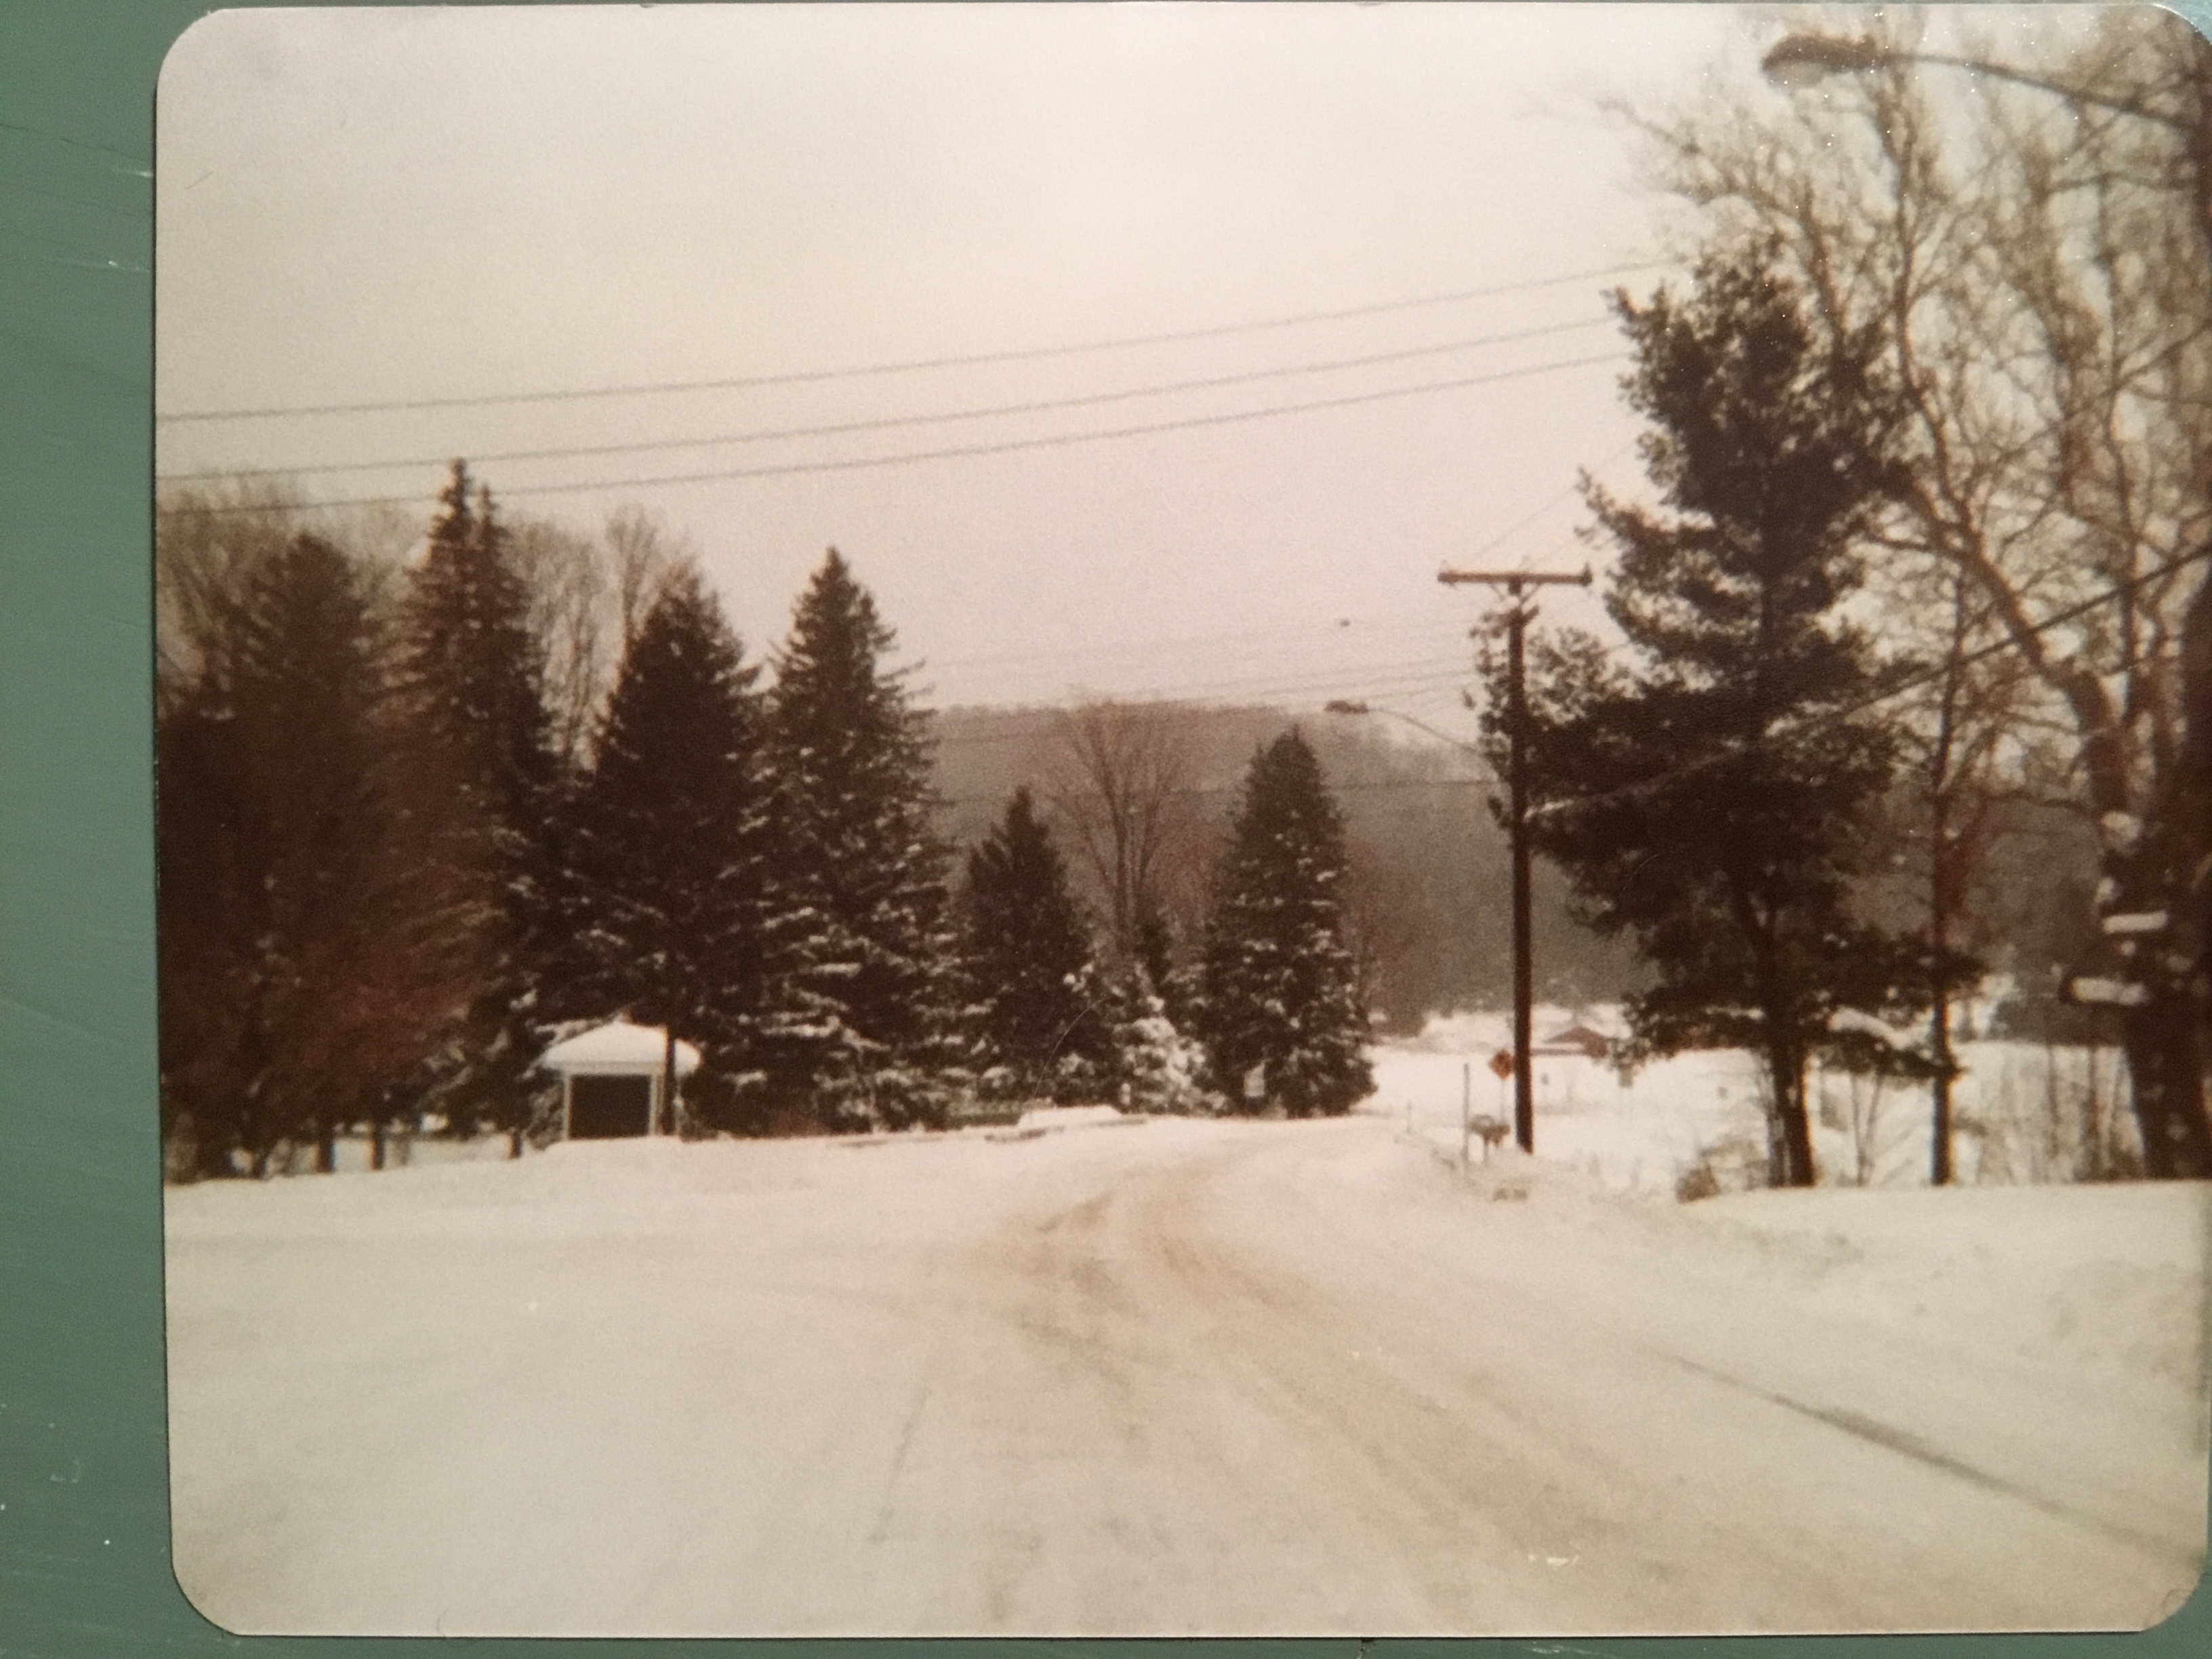
Butternut Creek at Morris Stream Gage
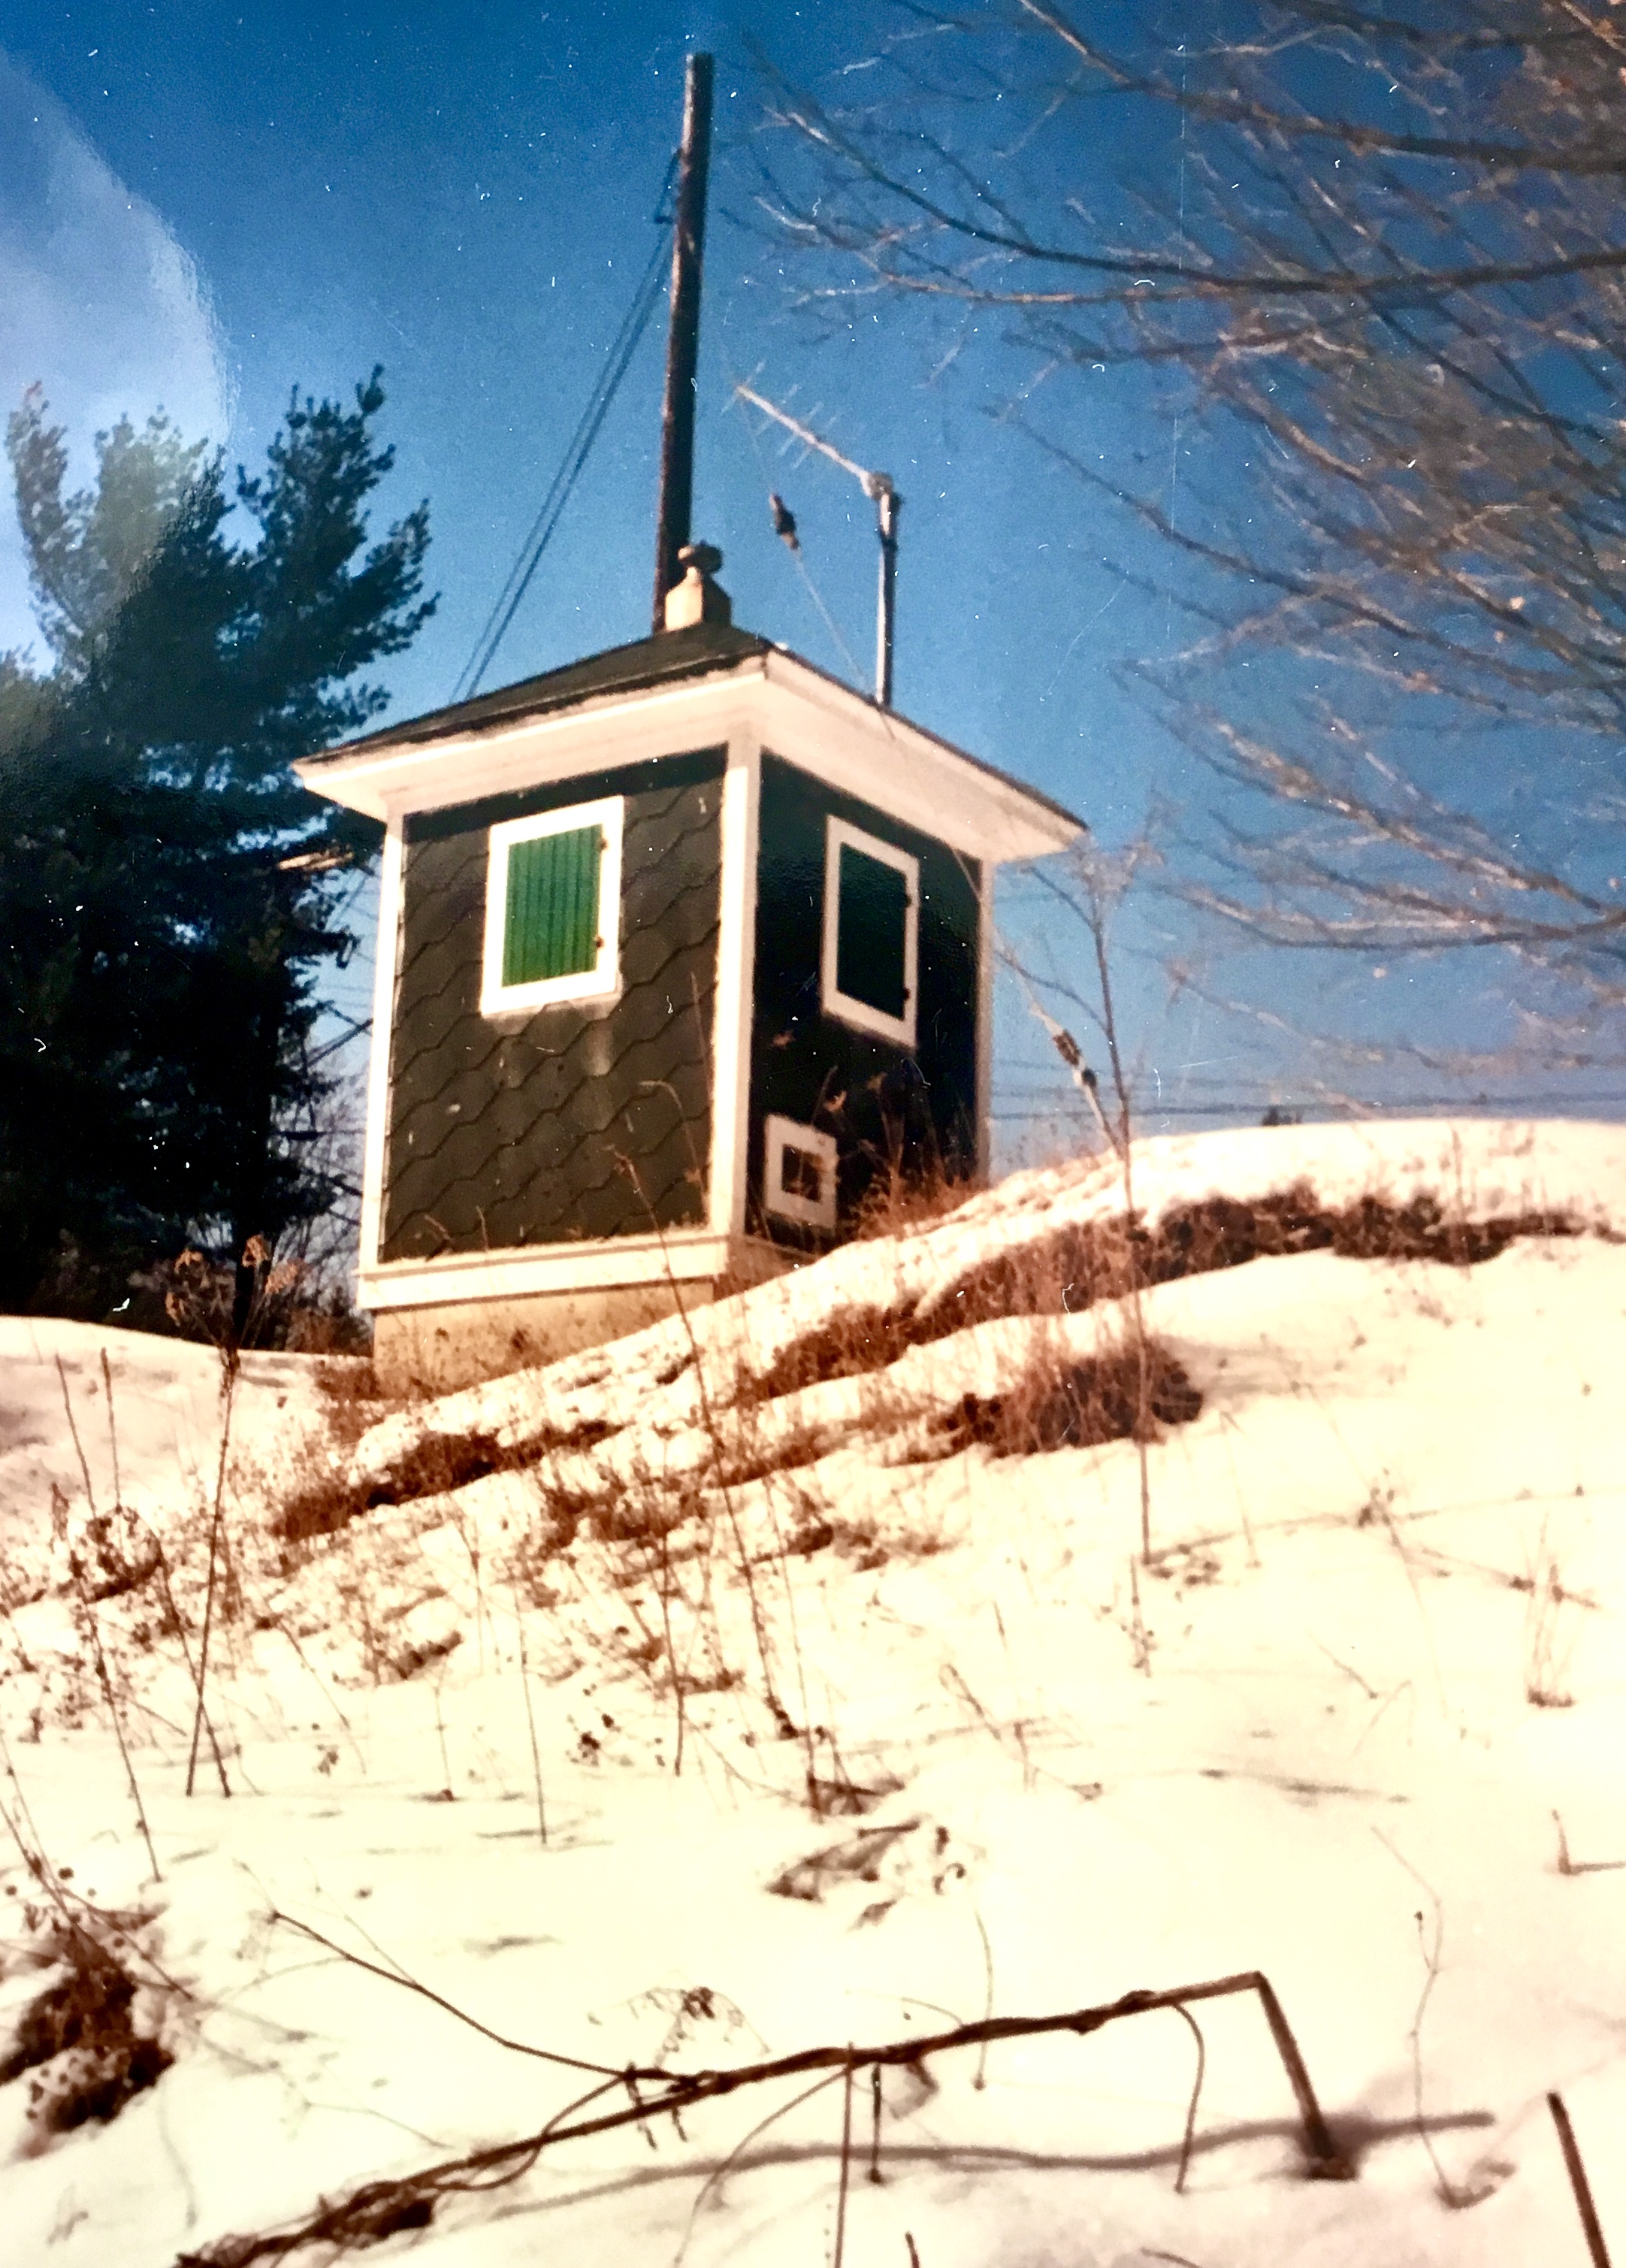
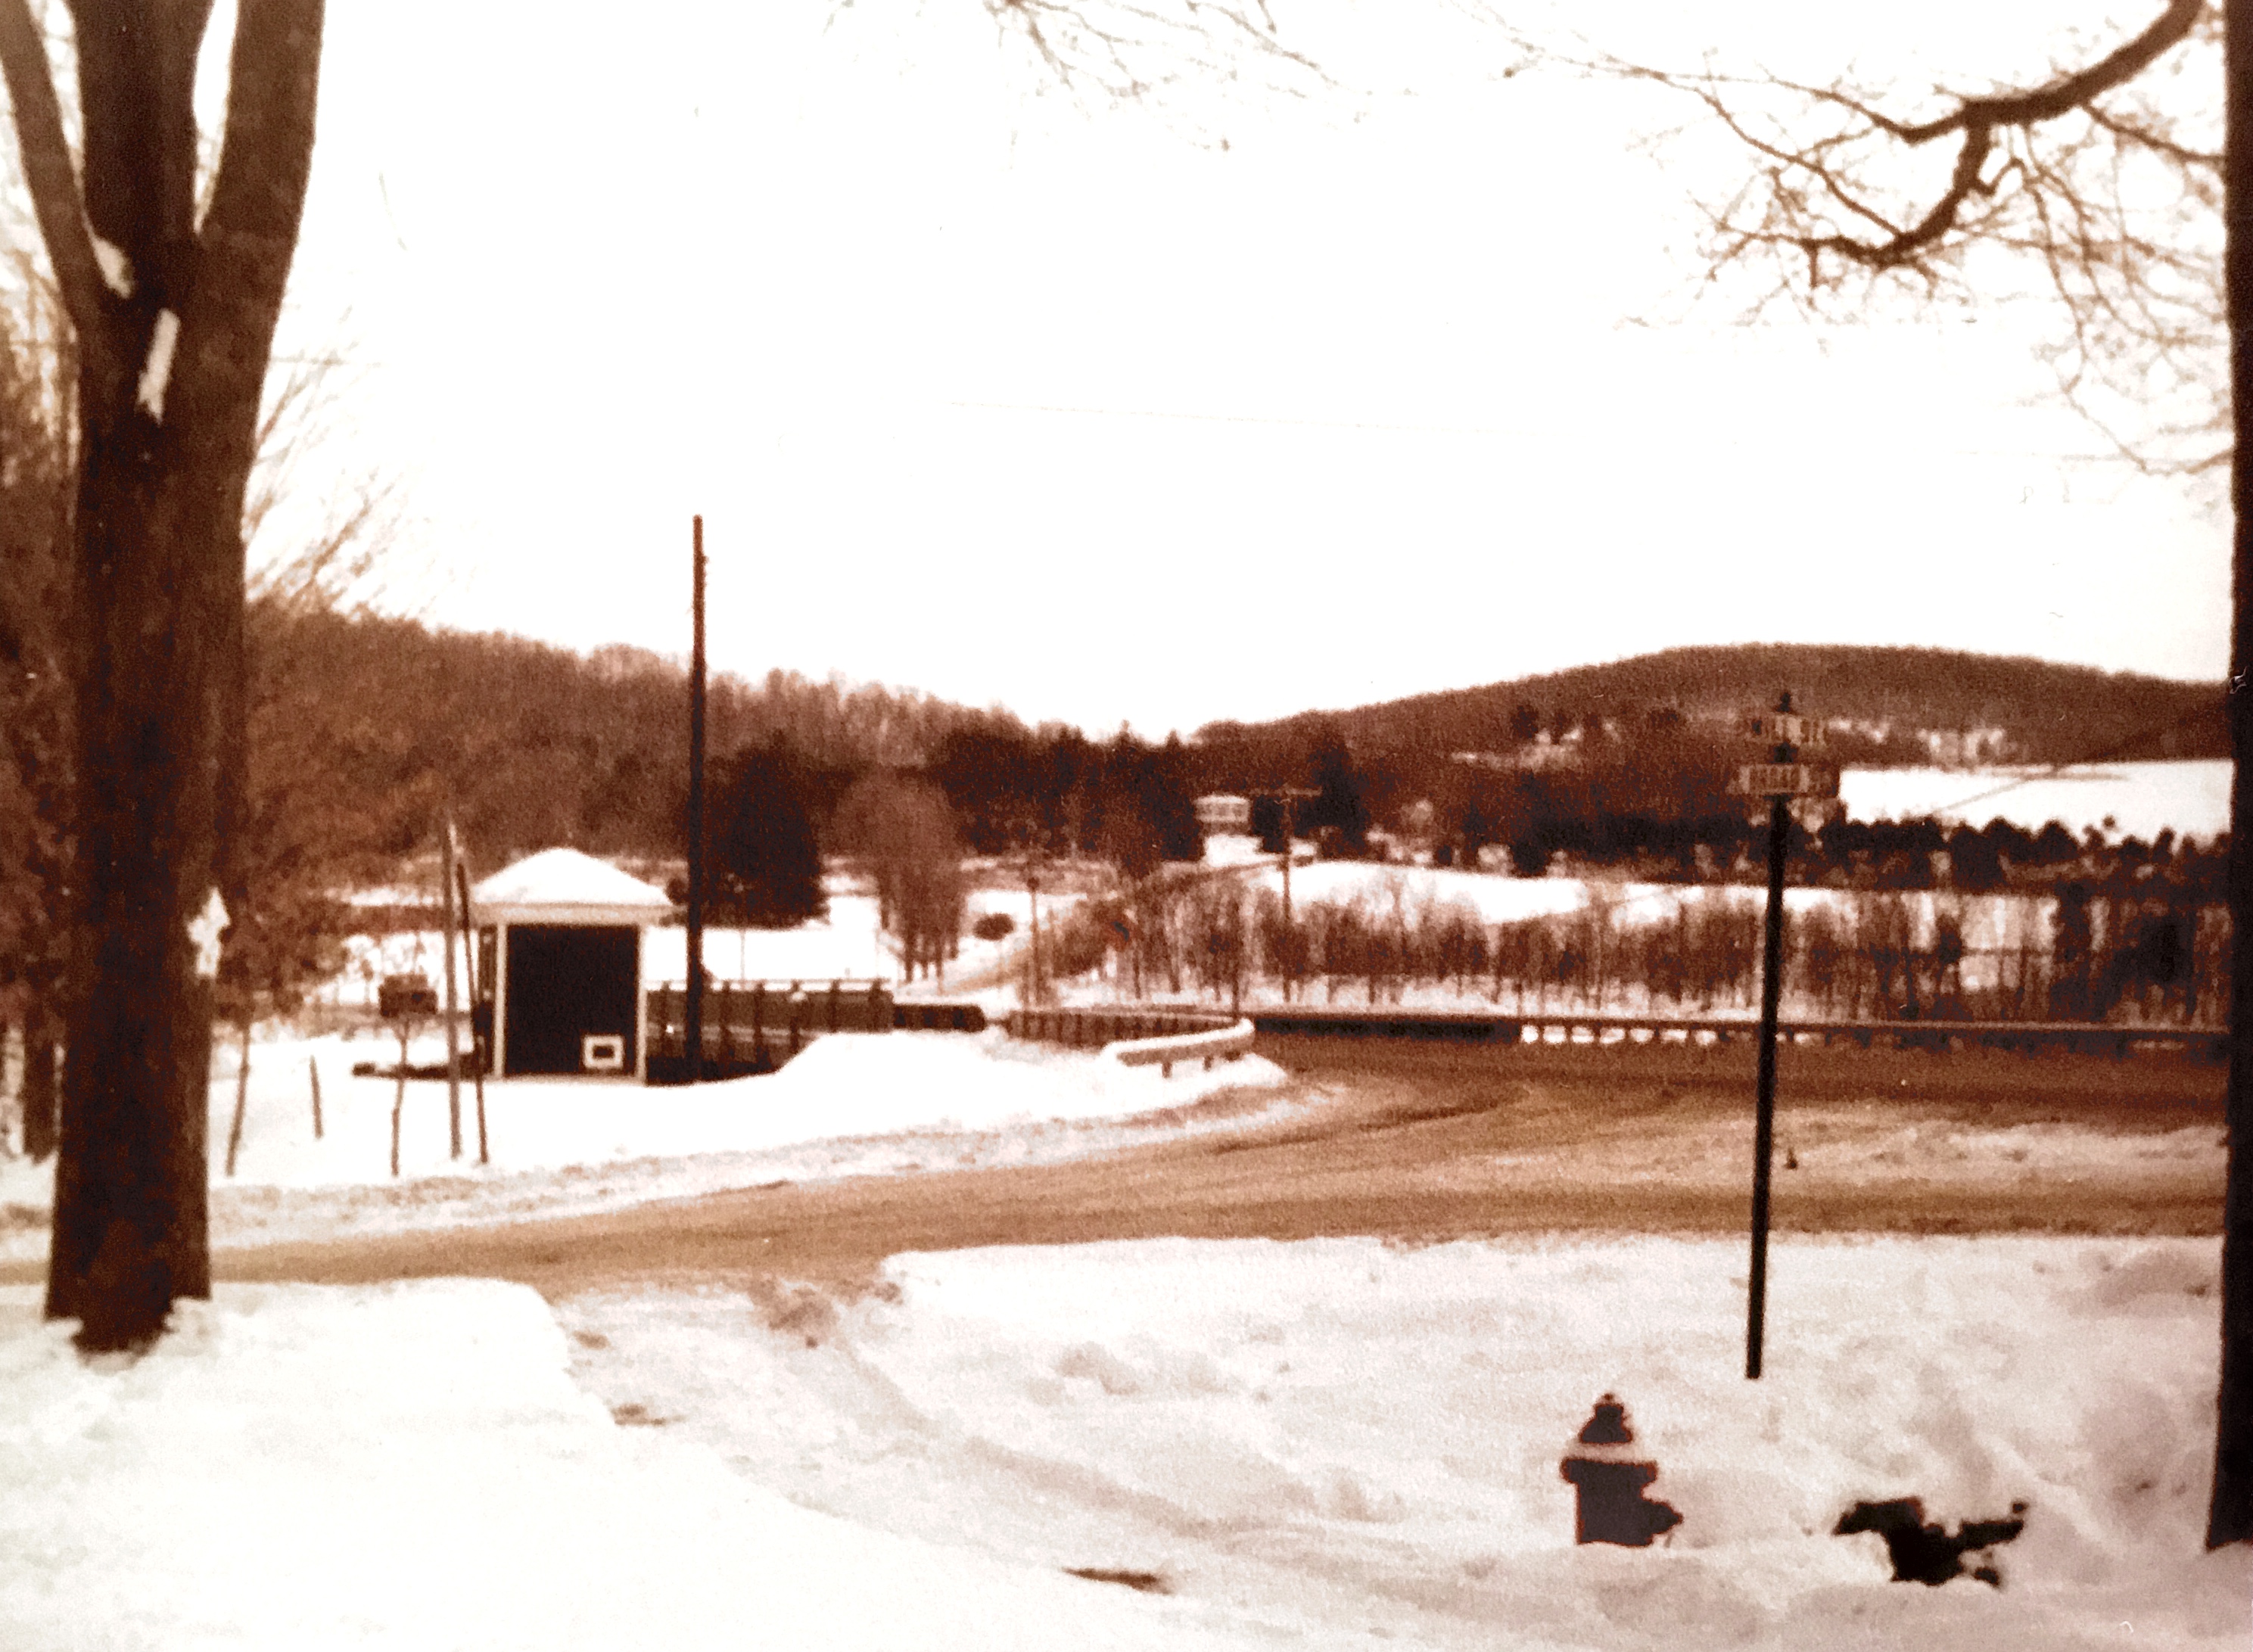
At one time and for a long time, say from the 1930's until 1995, there was a USGS Stream Gauge on the Butternut Creek near the Broad St. Bridge. I asked Rene Elliott if he had any photos of the gaging station. Turns out he has the station, but not the inner works and some photos.
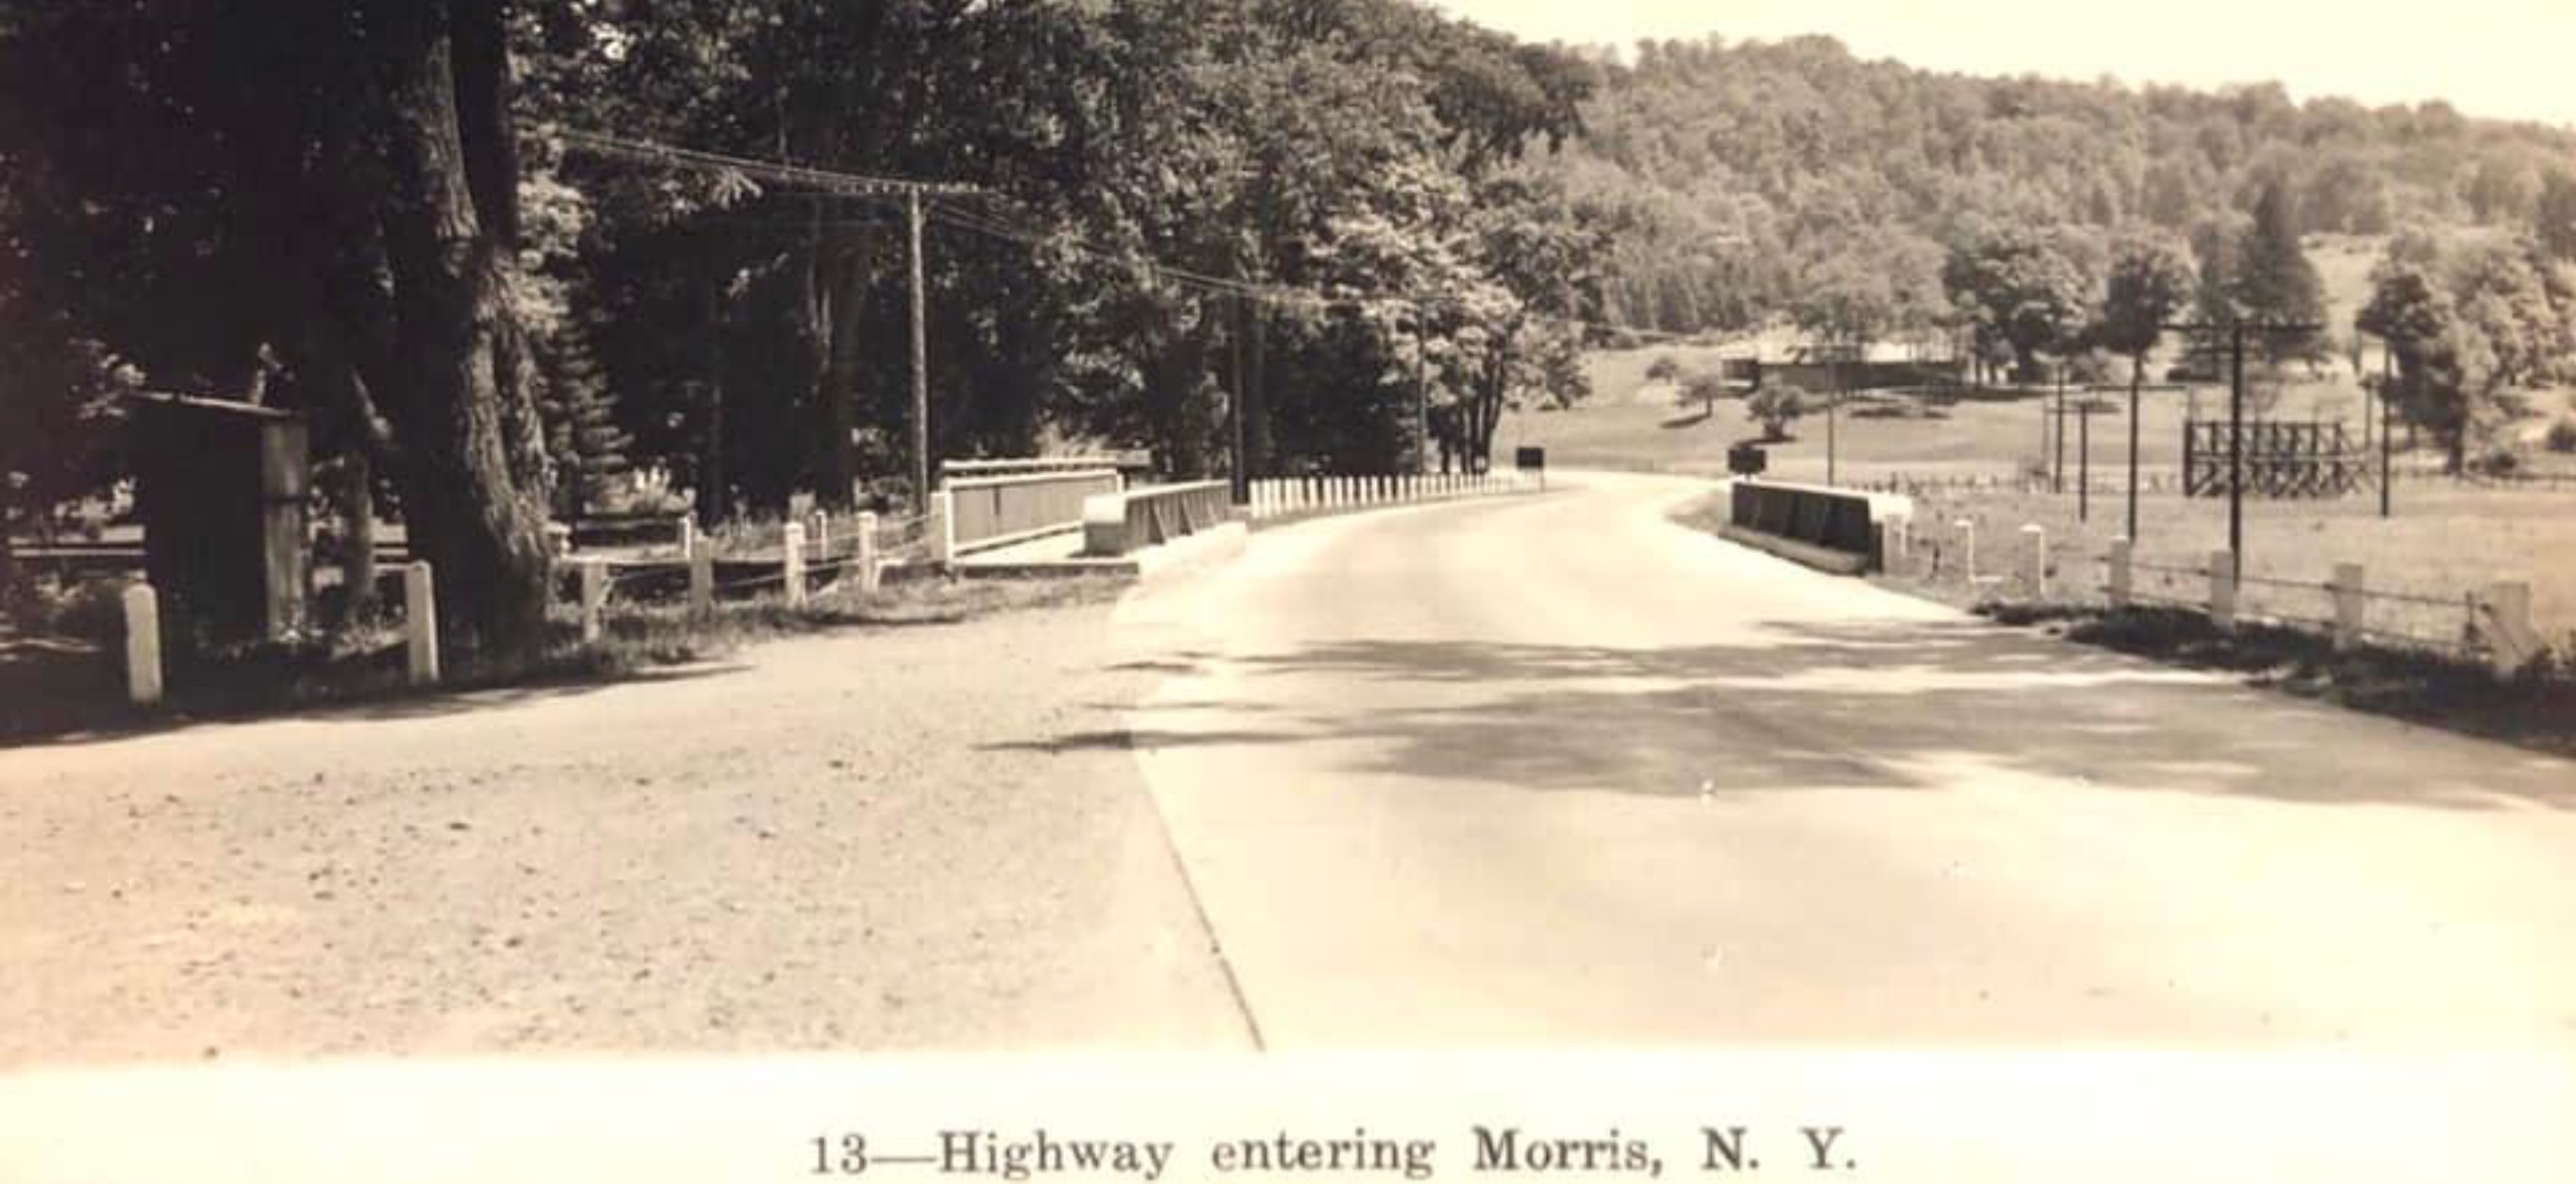
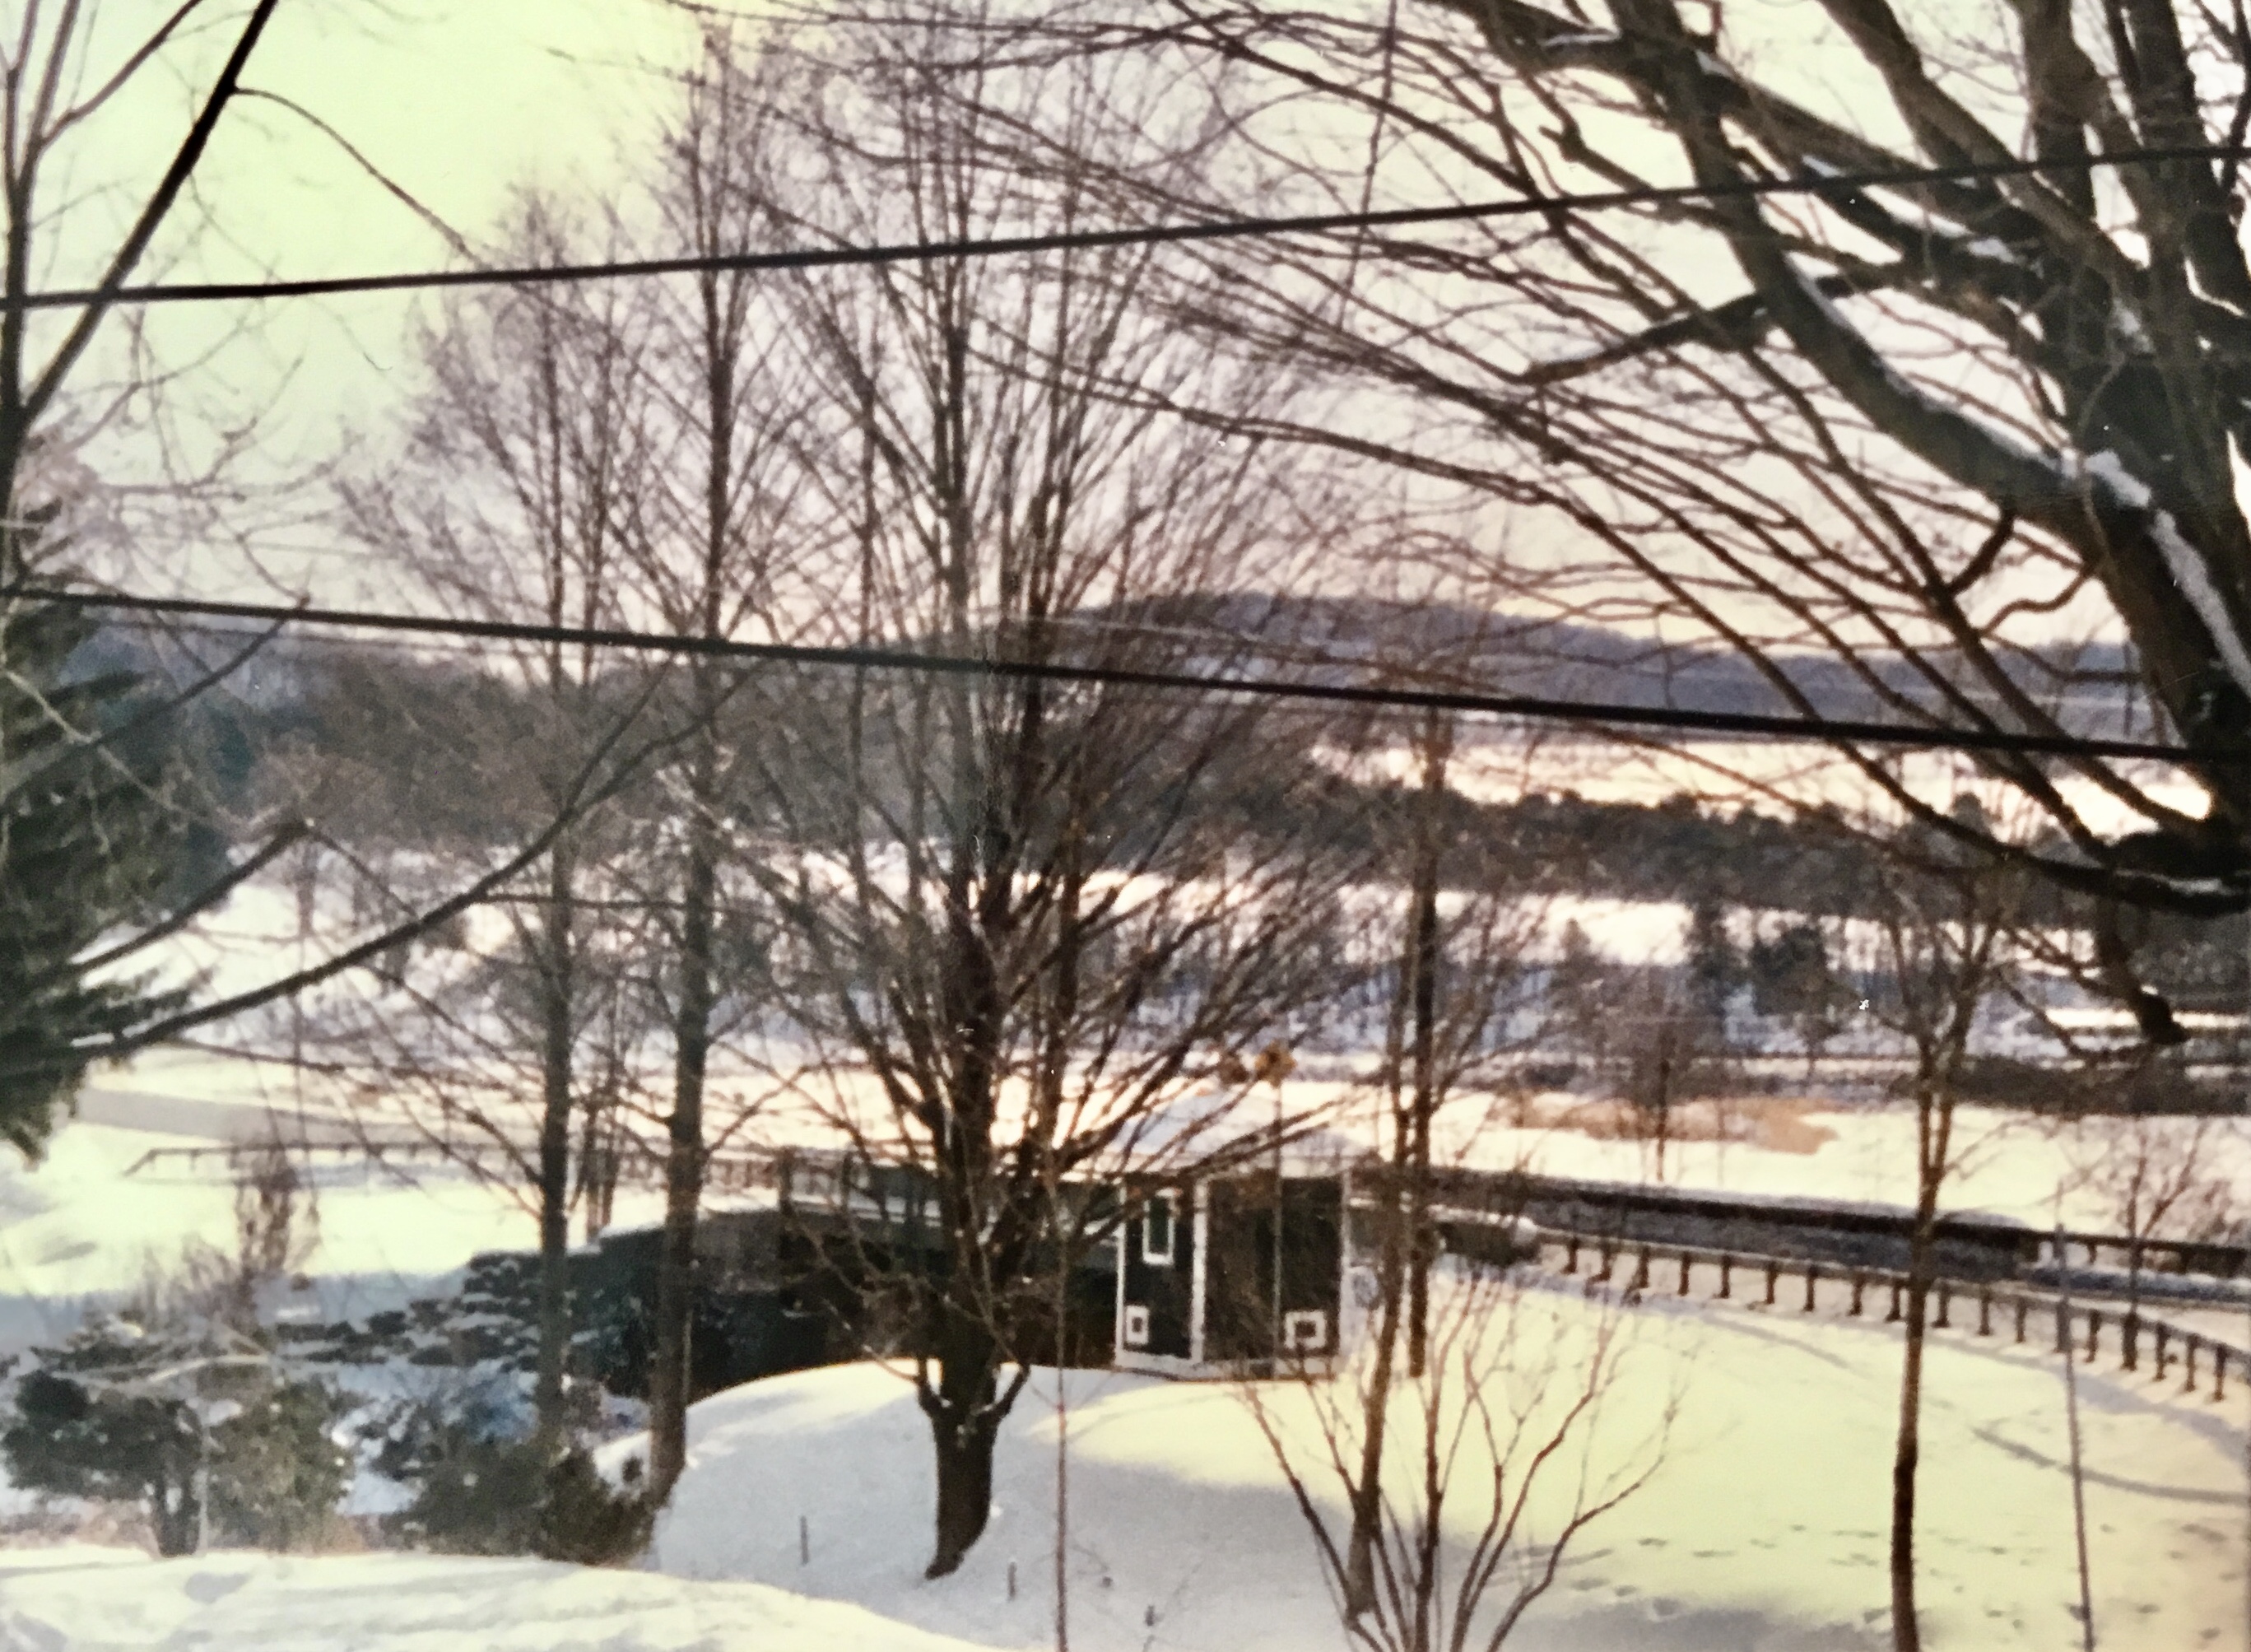
The sycamore tree Rene saved is prominent in the above view of the Franchot house before the fire.
Rene wrote:
I had the building moved to my backyard when they went to demolish it, in 1995. The original bridge detour plans would have been right in front of the Franchot house, requiring the removal of the big sycamore, the state engineer was apparently not aware the USGS had abandoned the building, but I talked with the technician who was removing the equipment maybe a few months earlier. My grandmother wasn’t happy with me for saying anything as she lost her maple trees, two of the three maples that were planted after the project were run into with a fire truck as they backed up to the dry hydrant that was put right below where the ditch dumps sediment into the stream, and the cistern was filled in a few years.
The USGS building now has a brown metal roof but needs a decent foundation, I was planning to relocate it again. Anna Harrington, who lived in the little trailer next to Earl Pickens (her brother, brown shingled house where Glenn & Leslie are now) was the only person we know of who would change the paper scroll, supposedly the data collection was for the purpose of planning future dam construction, Leigh Eckmair did quite a lot of research on that, and Les Stroh had some part in the dam opposition? My understanding is they opted for Rockdale on the Unadilla as the datapoint collection and area of any dam options in the future.
At one time the building had a shed roof.
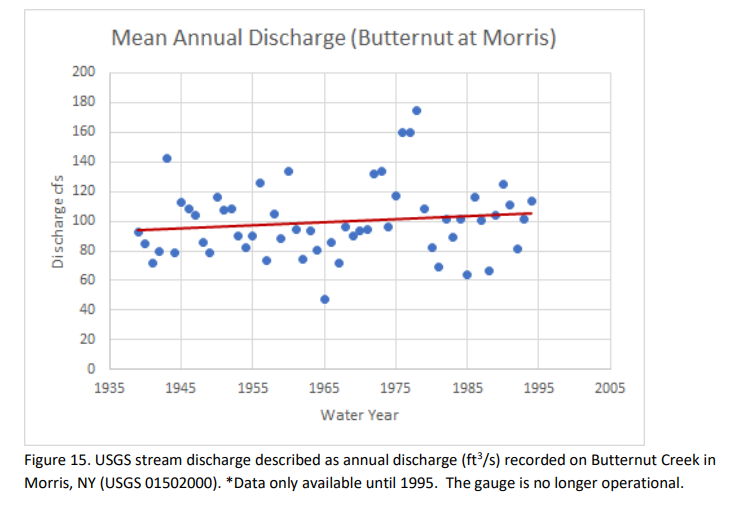
An example of some of the data collected by the gaging staging over nearly 60 years.
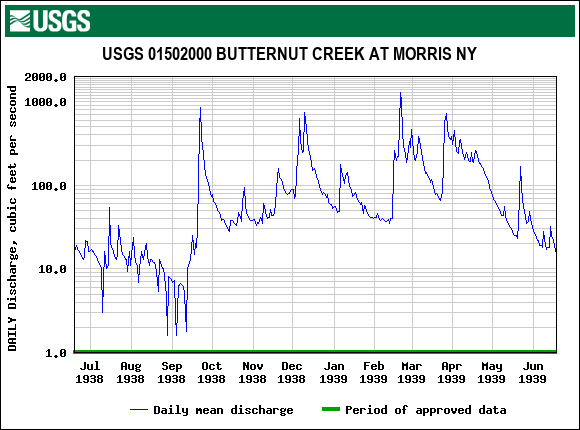
I took a look back to 1938-39 and produced a graph of daily mean discharge in cubic feet per second. The peak in September was the Hurricane of 1938. If you have never heard of 1938 Hurricane check out this link. It was a terrible storm over a large area.
https://en.wikipedia.org/wiki/1938_New_England_hurricane
Examine more data at the link below.
https://waterdata.usgs.gov/monitoring-location/01502000/#parameterCode=0...
Check out coverage of the storm in the Binghamton Press and Sun Bulletin attached below as PDF files.